|
Step
|
Action
|
|
22.
|
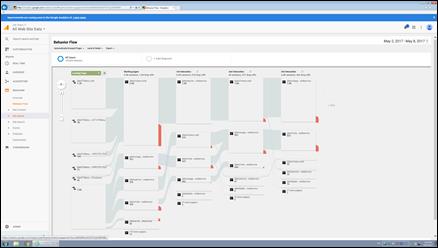
Click the Page
Title list item.

|
|
23.
|
Choosing page title is important, makes
the data readable.
|
|
24.
|
Click the May
2, 2017 object.
|
|
25.
|
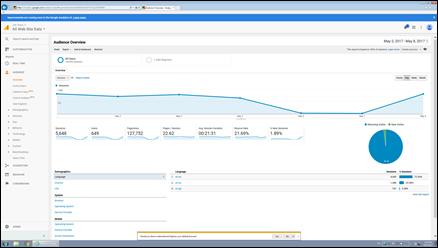
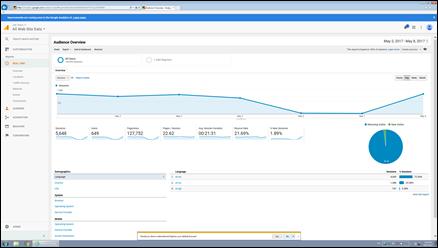
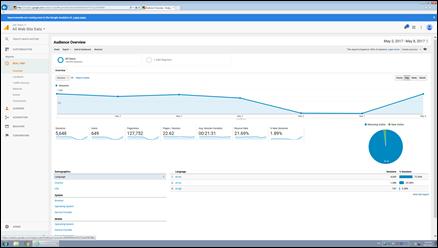
We are going to set some date
ranges. You can choose any date ranges for all of the reporting (except
for the real time data). Remember that this will apply to all screens
we look at from now on. Amazing!
|
|
26.
|
Click the 2
cell.

|
|
27.
|
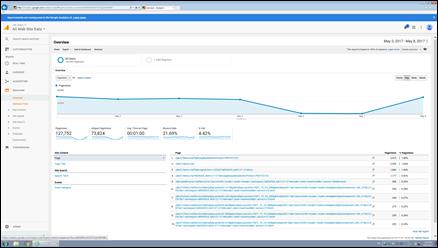
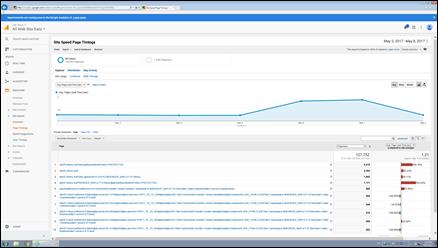
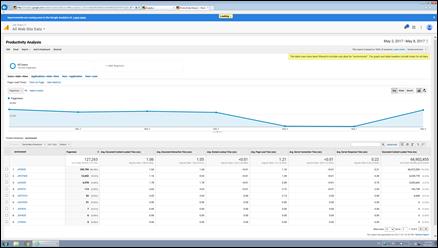
Clicking apply will allow you to see the
last 5 weeks of activity, it was 127,752 pages for 1 week.
Click the Apply
button.

|
|
28.
|
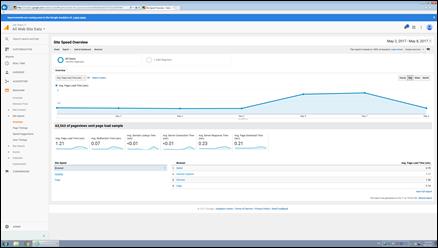
Now we are looking at about 600,000
individual page loads.
|
|
29.
|
Let's start looking into our custom
dimensions. We have a number of custom dimensions, listed below:
user - jde login name
application - APP_FORM_VERSION ->
P986162_W986162B
environment - JPD910
appid - P4210 (only available from
"Analysis" view )
formid - W4210A (only available from
"Analysis" view )
versionid - XJDE0001
Internal Host - machinename:port of the
web server
Used Memory - current used memory
reported from JVM heap
Click the Customization
object.

|
|
30.
|
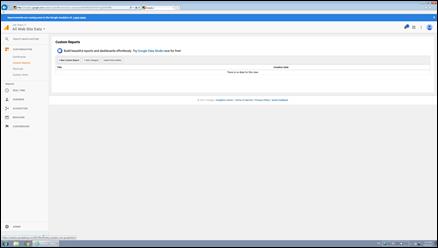
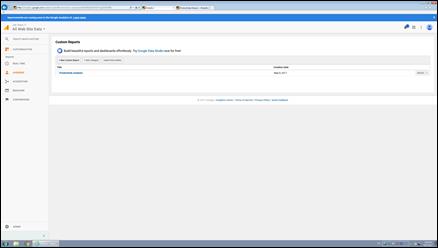
Click the Custom
Reports link.
|
|
Step
|
Action
|
|
42.
|
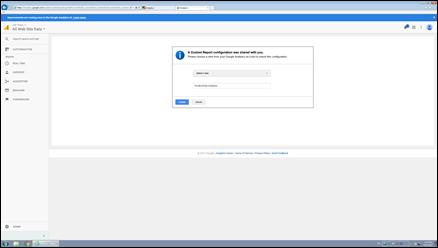
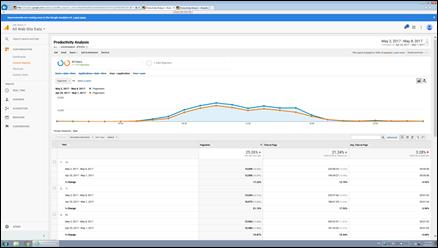
Now you can see your custom report which
uses the custom dimensions.
Click the JPD920
object.

|
|
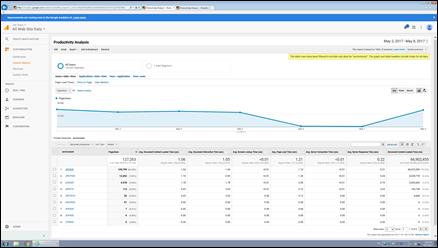
43.
|
Click the Time
on Page object.

|
|
44.
|
Click the Applications->date->time
object.

|
|
45.
|
Click the Secondary
dimension object.

|
|
46.
|
Choose page title as a secondary dimension
to see some "friendly names" for your applications
Enter the desired information into the Acquisition field. Enter "title".
|
|
47.
|
Click the Page
Title object.

|
|
48.
|
Click the Cumulative
Performance object.

|
|
49.
|
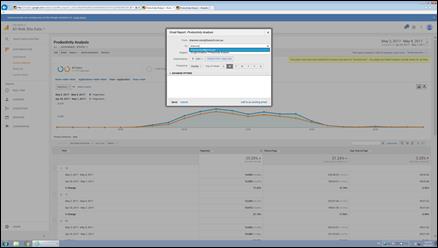
If you want to subscribe to this
information and have it sent to you on a regular basis, then follow these
steps.
Click the Email
tab.

|
|
50.
|
Enter the email address of who the
scheduled report should be delivered to.
Click in the Must
be a valid email address. field.
|
|
51.
|
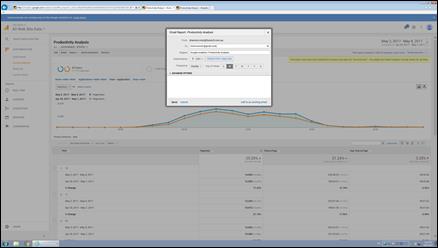
Enter the desired information into the Must be a valid email address. field. Enter
"shannonmoir@gmail.com".
|
|
52.
|
Click the Advanced
Options object.

|
|
53.
|
Choose how long you want the subscription
active for
Click the 6 months
object.

|
|
54.
|
Click the 2
months list item.
|
|
55.
|
Click the S
list item.

|
|
56.
|
Click in the Email
body is missing, please add a message. field.
|
|
57.
|
Enter the desired information into the Email body is missing, please add a message.
field. Enter "Hi Shannon,".
|
|
58.
|
Enter the body of the email
Press [Enter].
|
|
59.
|
Press [Enter].
|
|
60.
|
Enter the desired information into the Email body is missing, please add a message.
field. Enter "Here is the top 10 applications
for the last week.".
|
|
61.
|
Press [Enter].
|
|
62.
|
Press [Shift+Enter].
|
|
63.
|
Enter the desired information into the Email body is missing, please add a message.
field. Enter "Enjoy!".
|
|
64.
|
Press [Enter].
|
|
65.
|
Press [Enter].
|
|
66.
|
Enter the desired information into the Email body is missing, please add a message.
field. Enter "Shannon".
|
|
67.
|
Click in the Email
body is missing, please add a message. field.
|
|
68.
|
Enter the desired information into the Email body is missing, please add a message.
field. Enter " (you)".
|
|
69.
|
Click the Send
button.

|
|
70.
|
Click the Hour
->application object.

|
|
71.
|
Click the May
8, 2017 object.

|
|
72.
|
Choose another date range for the next
report
Click the Compare
to: option.

|
|
73.
|
We'll actually do a compare of last week
to this week. Make sure that you start the analysis on the same start
day (Tues-Tues) for me.
Click the Apply
button.
|
|
74.
|
Click the Email
tab.

|
|
75.
|
Click in the Must
be a valid email address. field.
|
|
76.
|
Enter the desired information into the Must be a valid email address. field. Enter
"shannon".
|