PROJECT DOOM
A Govhack 2014 Project by team FUS RO DATA
Benefits of Project Doom:
- Q: Who benefits? A: Anyone who is interested in the disaster risk of a certain area, be it for business, travel, planning, or buying a home.
- Q: How are they benefiting? A: For example, a concert promoter may be selecting a location to hold his next Big Day Out festival. Is the coastal location in any risk of a disaster? Now, with Project Doom, you can assess "Your Risk At a Glance".
Concept
Q: "What does this project aim to do?"
A: Project Doom answers the question:
"Where have disasters occurred in Australia since 1967, and what was their impact?"
We show this on an interactive map, delivering "Your Risk At a Glance".
Data Sets
Project Doom combines an audacious mix of the following data sets:
- Australian Emergency Management Knowledge Hub Data
- Insurance Council of Australia Historical Disaster Statistics
- OpenStreetMap (Map Data)
Technology
Project Doom uses the PostgreSQL DBMS for processing data, and the Javascript programming language for map animation and effects.
Project Doom is built on the following technology stack:
- Database: PostgreSQL
- Javascript Libraries: Leaflet, jQuery
postgresql.org, openstreetmap.org, leafletjs.com, jquery.org, developer.mozilla.org/en/docs/JavaScript
Project Code
Project Doom source code is on Github here:
https://github.com/TheRealEdDawson/Project-Doom
Project Doom is live here:
http://www.fusrodata.com/projectdoom
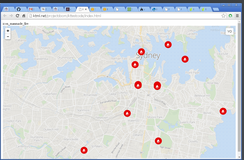
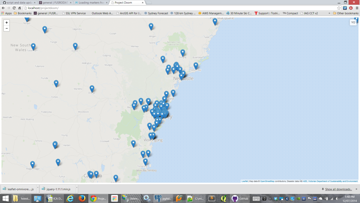
Australian Disasters Visualised
The map covers the boundaries of Australia. The locations of disasters is shown.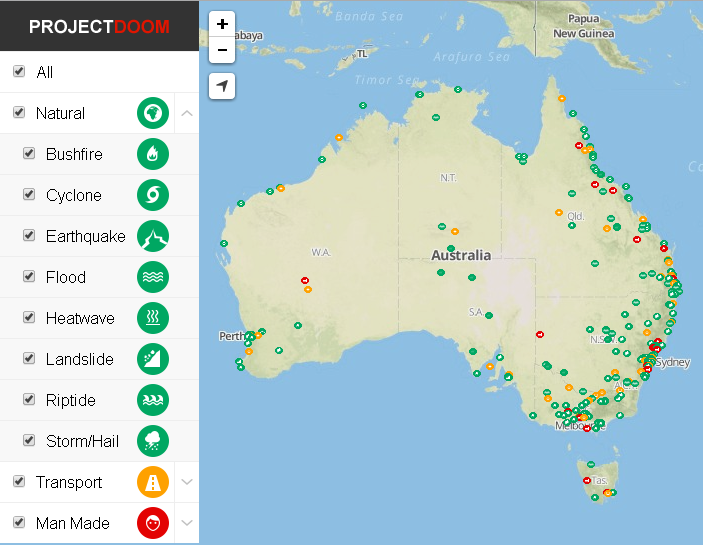
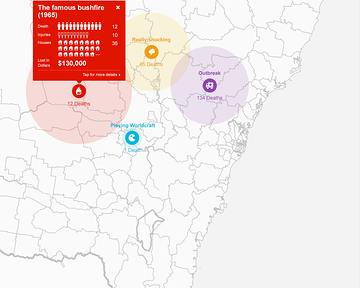
Disaster Explorer
Clicking on the categories shows where disasters happened, along with the total impact.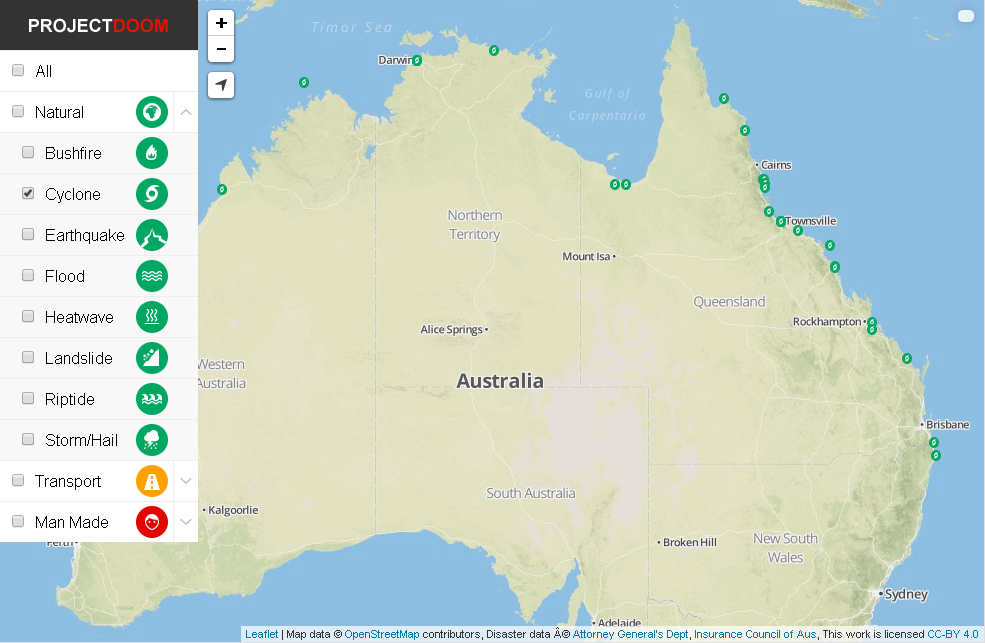
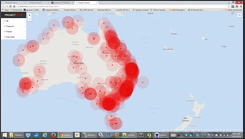
Disaster Type Breakdown
Click on the categories to see only one type of transport for the area in context. You can click on the map or a disaster type to zoom in and see the local area near the disaster.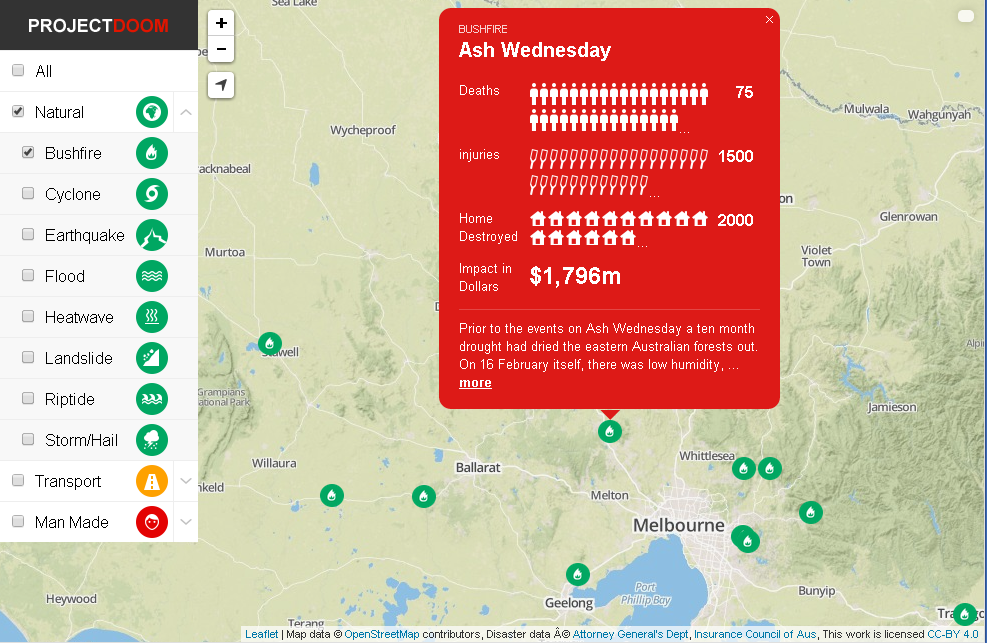
Project Doom Demo
http://www.fusrodata.com/projectdoom
Future Work
To extend Project Doom, the next steps would be to add possibly realtime data feeds that show disaster zones in progress.Meet The Team
FUS RO DATA is:
 Geo-Expert, Data Master Geo-Expert, Data Master |  Technical Writer, Python Hacker Technical Writer, Python Hacker |  Elite Designer, Front-End Wizard Elite Designer, Front-End Wizard |
What is "FUS RO DAH"? http://knowyourmeme.com/fusrodah
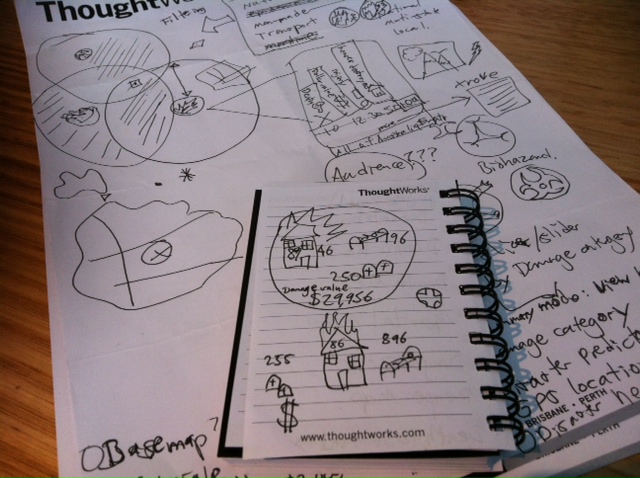
Work in Progress Snaps
 | 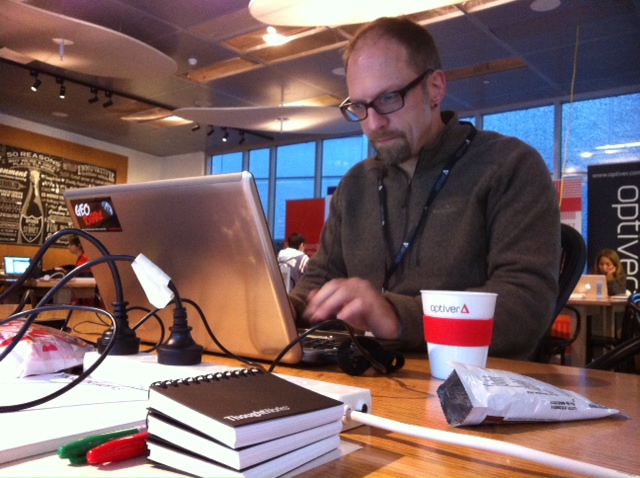 | 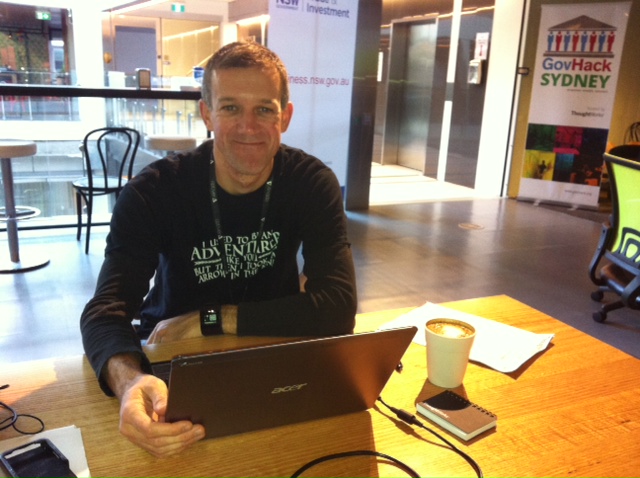 |
 |  |  |
THE END
A big thank you to the Govhack 2014 organisers!A Govhack 2014 Project by team FUS RO DATA
http://www.fusrodata.com/projectdoom