More female runners
More male runners
500 runners
250
250
500 runners
2:52
per km
40min
2017
2017
5:01
per km
70min
7:11
per km
100min
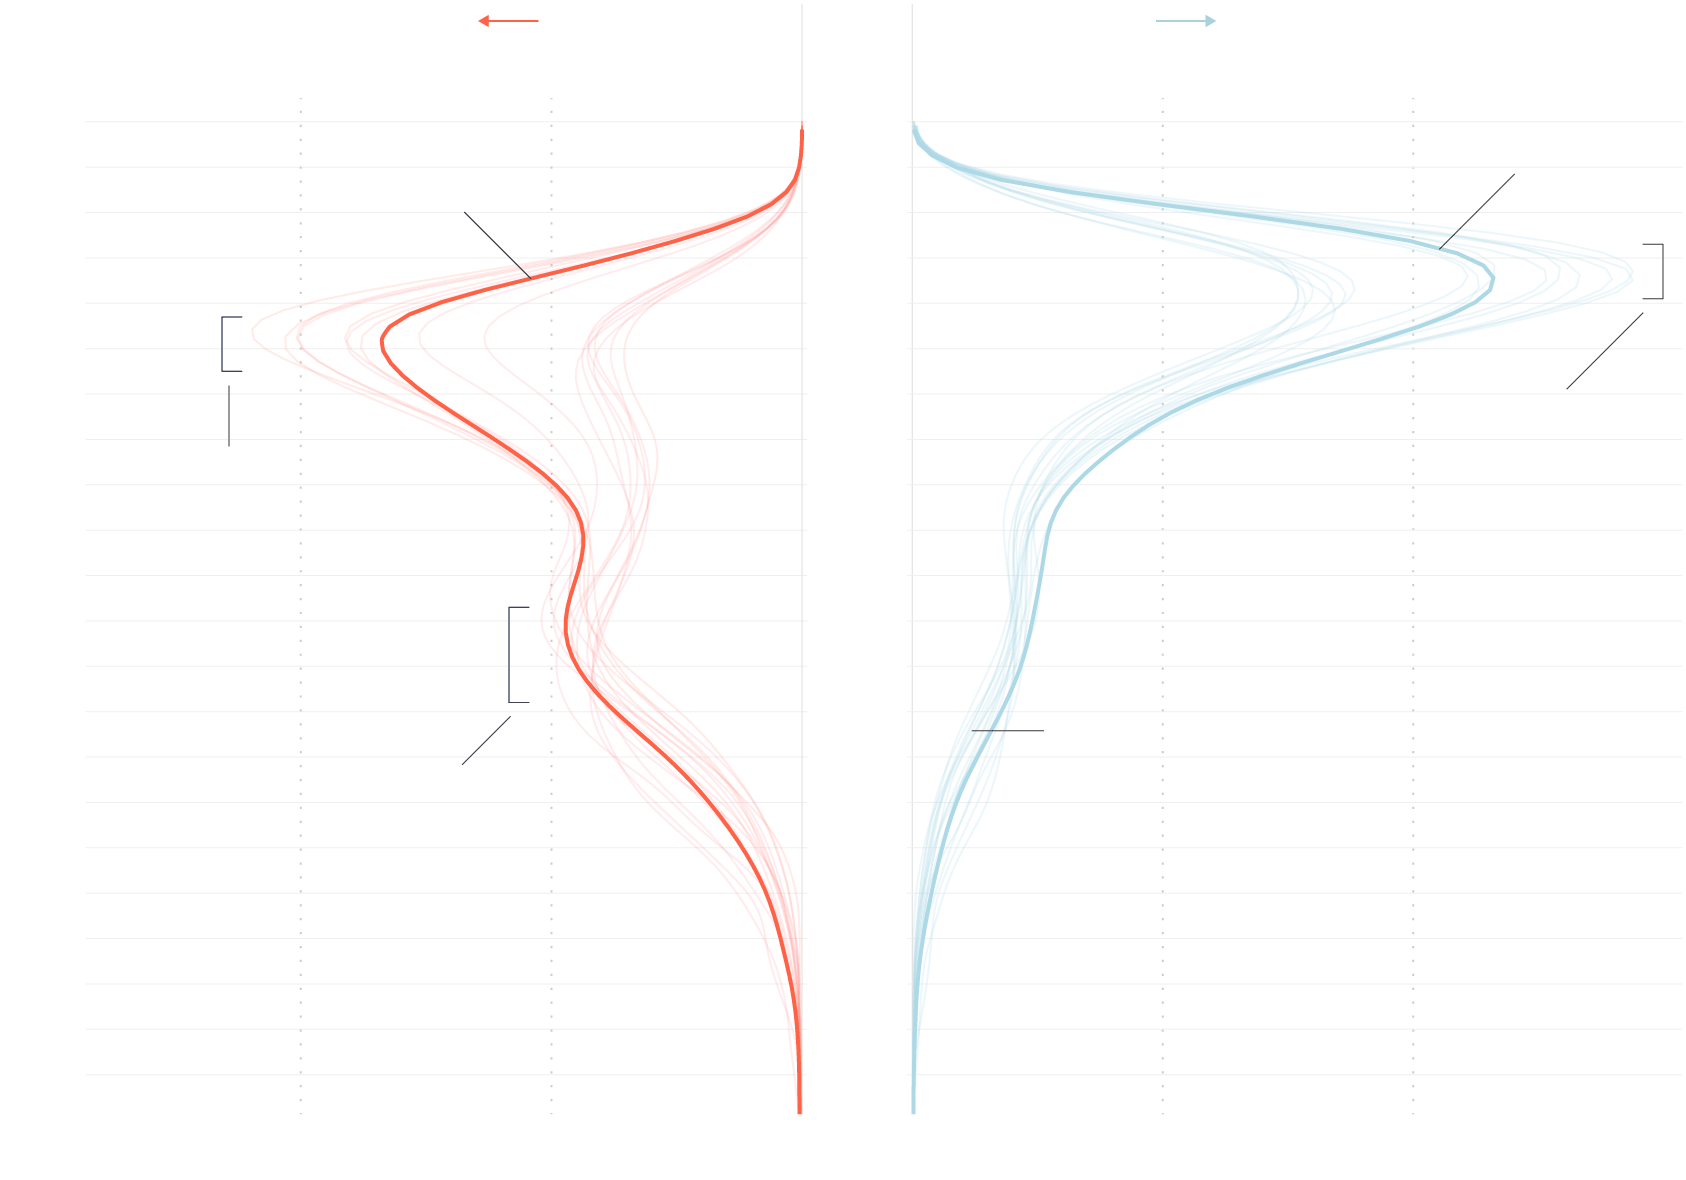
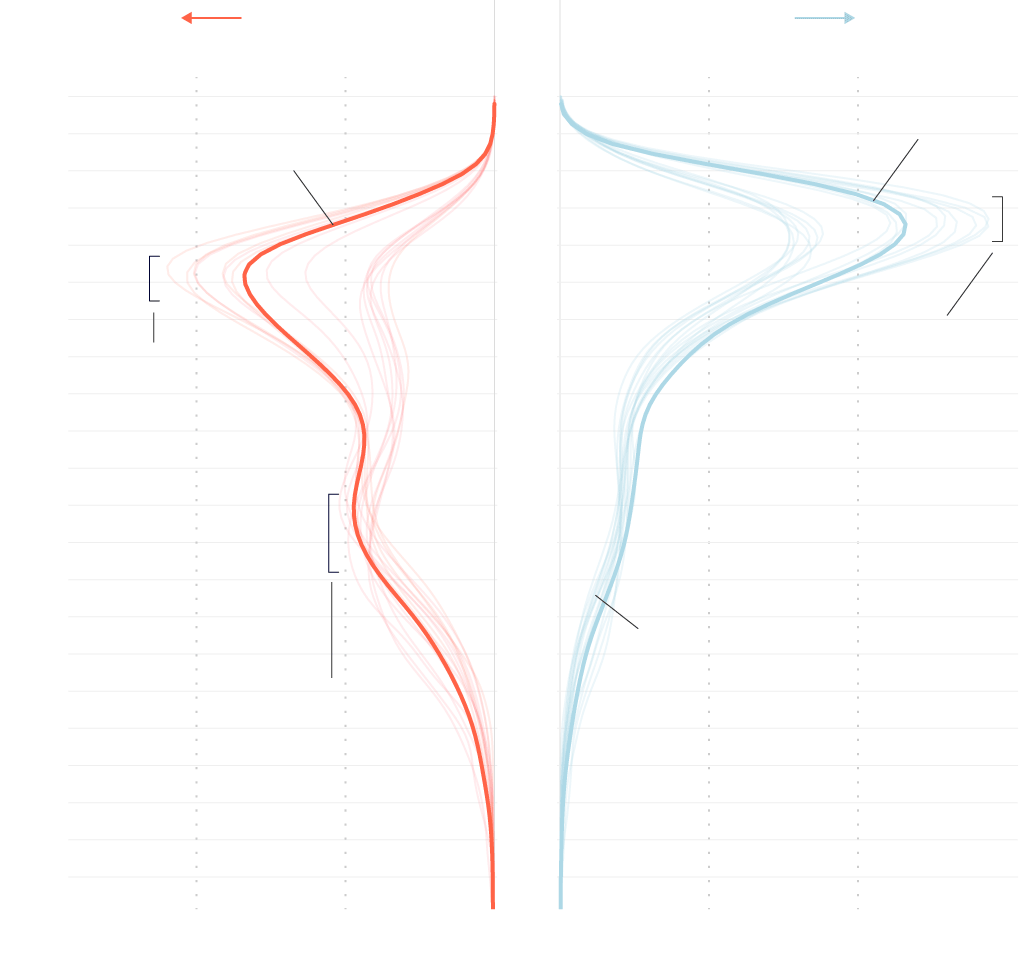
Among all years, the majority of men finished between 67 and 79 minutes. There is a higher variance in number of runners within these finish times.
In recent years, including 2017, the majority of women finished between 83 and 95 minutes. There is a higher variance in number of runners within these finish times.
9:20
per km
130min
11:30
per km
160min
There are generally fewer men than women with slow finish times. The number of slower runners and walkers varies much less for men than it does for women.
In earlier years, the majority of women finished with times between 147 and 168 minutes.
13:39
per km
190min
15:48
per km
220min
17:58
per km
250min
Finish time
More female runners
More male runners
500 runners
250
250
500 runners
2:52
per km
40min
2017
2017
5:01
per km
70min
7:11
per km
100min
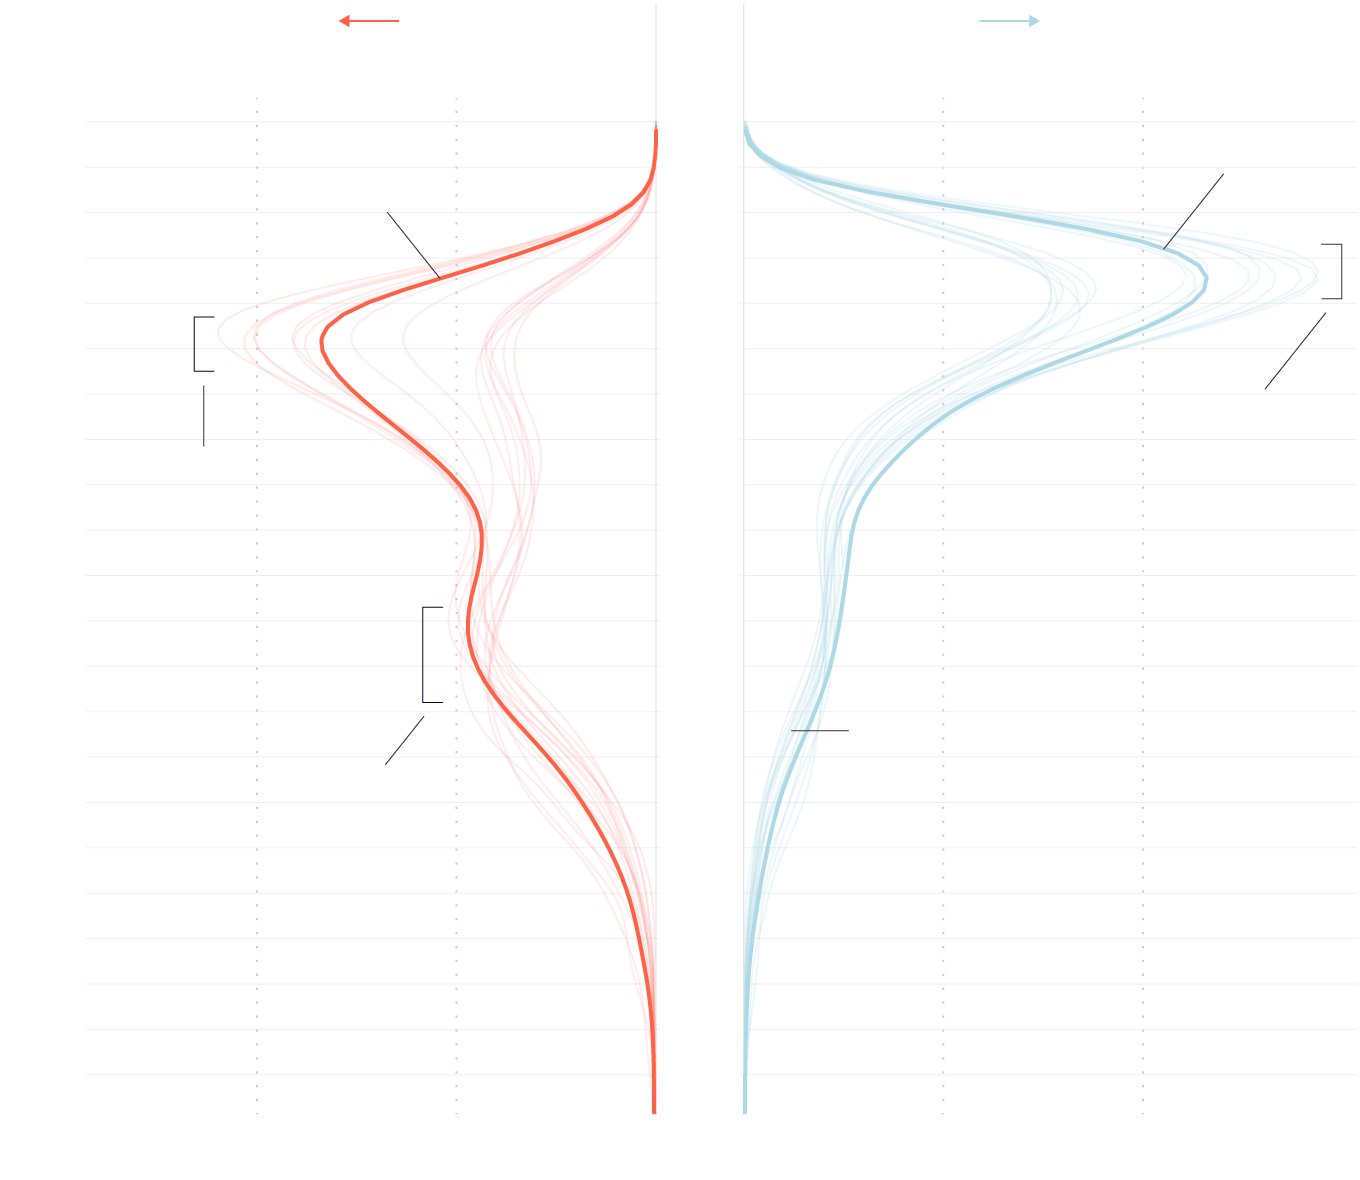
Among all years, the majority of men finished between 67 and 79 minutes. There is a higher variance in number of runners within these finish times.
In recent years, including 2017, the majority of women finished between 83 and 95 minutes. There is a higher variance in number of runners within these finish times.
9:20
per km
130min
11:30
per km
160min
There are generally fewer men than women with slow finish times. The number of slower runners and walkers varies much less for men than it does for women.
In earlier years, the majority of women finished with times between 147 and 168 minutes.
13:39
per km
190min
15:48
per km
220min
17:58
per km
250min
Finish time
More female runners
More male runners
500
250
250
500
40 min
2017
2017
70 min
100 min
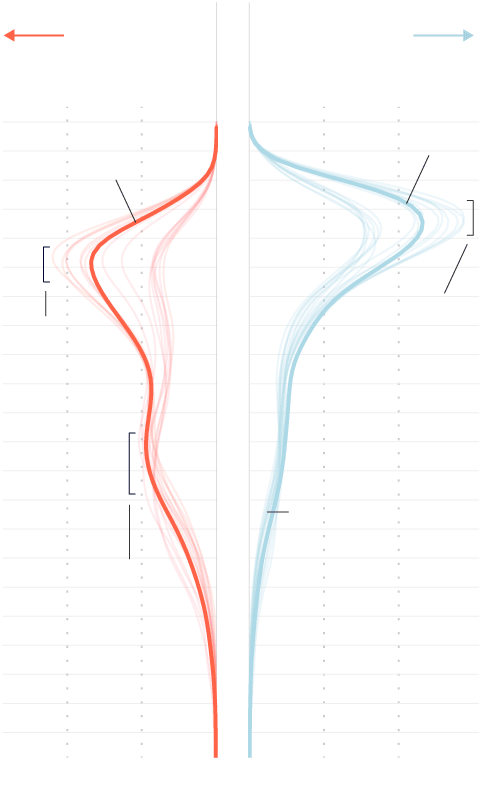
The majority of men finished between 67 and 79 minutes.
The majority of women finished between 83 and 95 minutes.
130 min
160 min
There are generally fewer men than women with slow finish times.
190 min
In earlier years, the majority of women finished with times between 147 and 168 minutes.
220 min
250 min
Finish time
More female runners
More male runners
500 runners
500 runners
250
250
2:52
per km
40
min
2017
2017
5:01
per km
70
min
7:11
per km
10
min
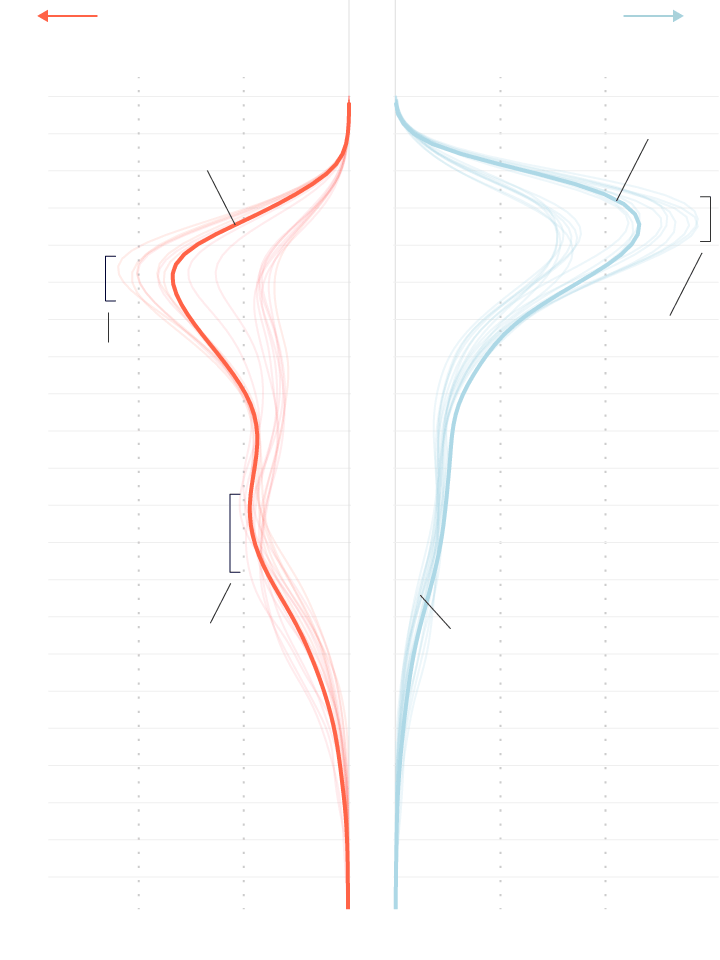
Among all years, the majority of men finished between 67 and 79 minutes. There is a higher variance in number of runners within these finish times.
In recent years, including 2017, the majority of women finished between 83 and 95 minutes.
9:20
per km
13
min
11:30
per km
160
min
There are generally fewer men than women with slow finish times. The number of slower runners and walkers varies much less for men than it does for women.
In earlier years, the majority of women finished with times between 147 and 168 minutes.
13:39
per km
190
min
15:48
per km
220
min
17:58
per km
250
min
Finish time
More female runners
More male runners
500 runners
250
250
500 runners
2:52
per km
40
min
2017
2017
5:01
per km
70
min
7:11
per km
10
min
Among all years, the majority of men finished between 67 and 79 minutes. There is a higher variance in number of runners within these finish times.
In recent years, including 2017, the majority of women finished between 83 and 95 minutes. There is a higher variance in number of runners within these finish times.
9:20
per km
13
min
11:30
per km
160
min
There are generally fewer men than women with slow finish times. The number of slower runners and walkers varies much less for men than it does for women.
13:39
per km
190
min
In earlier years, the majority of women finished with times between 147 and 168 minutes.
15:48
per km
220
min
17:58
per km
250
min
Finish time